CLIMAAX MARCAdapt project - Barcelona workshop
Municipality of 12th District of Budapest (Hegyvidék Municipality) participates as a pilot region in the Horizon CLIMAAX project (CLIMAte risk and vulnerability Assessment framework and toolboX) in the framework of a Sub-Grant Agreement between 2024 and 2026. The objective of the project is to learn the climate risk assessment methodology developed by the CLIMAAX partnership and apply it on the territory of Hegyvidék Municipality on urban block level.
Basic information about the project
- Beneficiary: Municipality of 12th District of Budapest (Hegyvidék Municipality)
- Project Acronym: MARCAdapt (Managing Risks towards a Climate Adaptive Hegyvidék)
- Duration: October 1, 2024 - July 31, 2026
- Budget: € 163,500 (100% EU funded)
Hegyvidék Municipality participated in a workshop organized by the CLIMAAX partnership in Barcelona, June 10-11, 2025 where a poster was presented about the progress of the pilot project. (See the poster here) This article proposes a more detailed, extended version of the information presented on the poster.
URBAN BLOCKS, CLIMATE SHOCKS
Adapting climate risk assessment on urban block level in city environment
BACKGROUND – About the 12th District of Budapest
The 12th District of Budapest (Hegyvidék Municipality) is located on the western side of the city of Budapest, Hungary. The high vulnerability of Hegyvidék Municipality is mainly determined by its the specific microclimate caused by hilly topography (up to 400 m difference in level between the highest and the lowest points) and the local population characteristics: 33% of the local population are elderly (above 60).
In Budapest a double municipal government system is in place, which means that some sectors are operated by the City of Budapest, other areas are managed by the district municipalities. Responsibilities practically vary street by street, hindering harmonized interventions in case of climate hazards.
Hegyvidék Municipality has to face the accelerating rise of the annual avg. temperature, locally reaching an avg. growth of +1,25 °C. Also, heavy rain events and flash floods have occurred in Budapest more and more frequently (avg. + 2 days with heavy rain/year) while drought periods and heatwaves have become longer (avg. +4 days of drought/year; avg.+18,4 days with heatwaves/year) in the last decades.
Hegyvidék Municipality carries out 3 risk assessments in the project: heavy rainfall, heatwaves, drought. A community involvement programme is also part of the project.
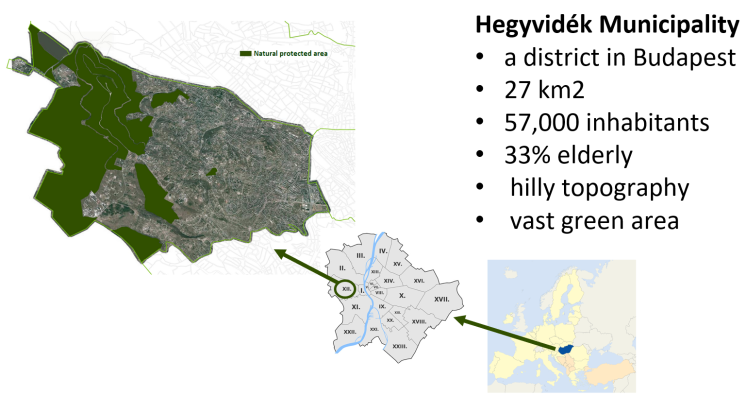
Location and main characteristics of Hegyvidék Municipality
Deliverable Phase 1, Chapters 1.1 Background, 2.1. Scoping, 2.2 Risk Exploration
PROJECT TEAM AND STAKEHOLDERS
Project management team
The Green Office and the International Projects Office of Hegyvidék Municipality are in charge of the general project management, the coordination of the involved experts, and the communication with other municipal departments, the Mayor and the City Council.
External experts
In addition, three Budapest-based external experts are involved in the implementation of the project:
- External data scientist - Milán Janosov phd.
- External climate change expert - EnviAdapt Kft. (Lilian Fejes)
- External communication and participation expert - Urbavis Kft. (Dorottya Teveli-Horváth phd., Anita Szőllőssy)
- Universities, public and private research centers
- Regional actors related to the blue-green infrastructure of Hegyvidék
- Companies of the City of Budapest (e.g. Budapest Sewage Company, Budapest Transport Center)
- Relatable projects (e.g. INTERREG, LIFE etc.)
- National public bodies (e.g. ministries)
- Others (insurance companies, telecommunication companies etc.)
- Educational institutions (nurseries, kindergartens)
- Healthcare institutions (public and private, general and specific)
- Social care institutions (elderly homes, homeless care etc.)
- Religious institutions
- Law enforcement bodies (police, civil police etc.)
- NGOs
- Cultural, sport etc. communities
- Condominiums, informal neighborhood communities
HEAVY RAINFALL
|
Technological University of Budapest, Department of Water Utilities and Environmental Engineering |
Cooperation in the past, runoff modelling, sewer vulnerability (LIFE in RUNOFF project) |
|
Budapest Transport Center |
Transport, traffic, also road safety and accidents data closely linked to weather extremes |
|
Budapest Sewage Company |
Data about spills and leaks highlight important points |
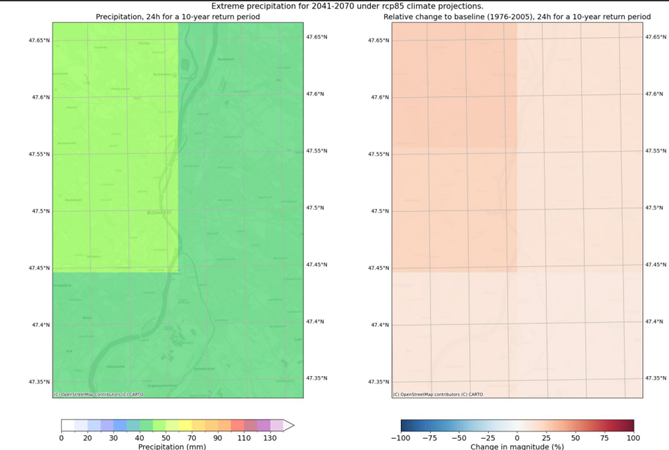
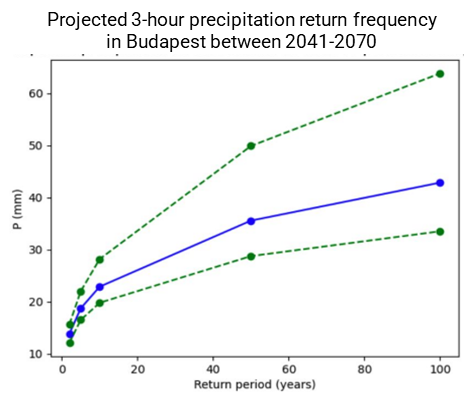
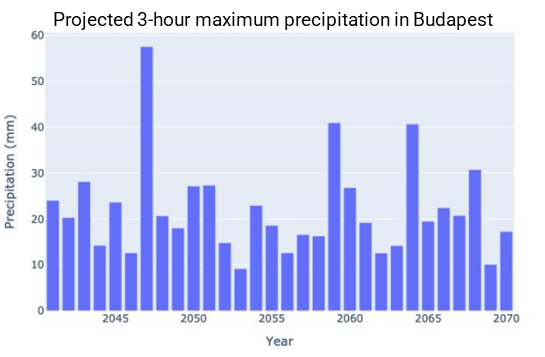
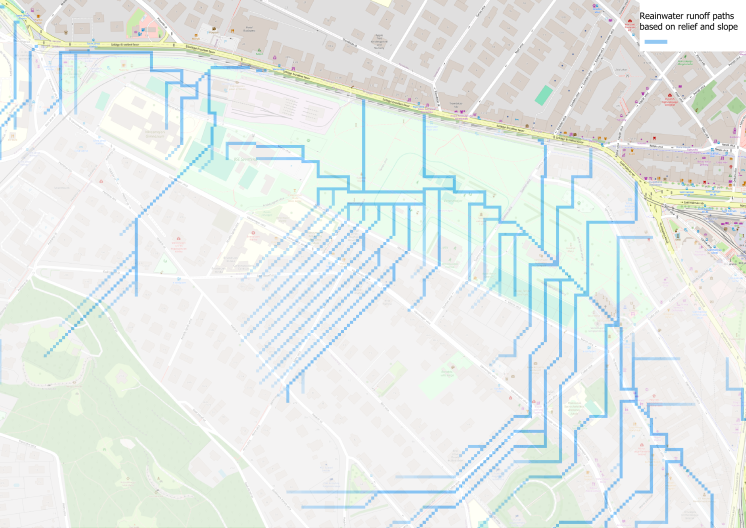
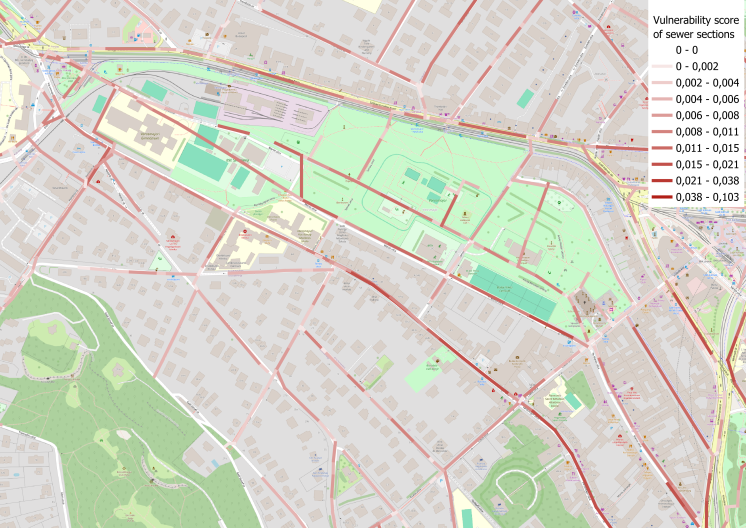
Heavy Rainfall hazard assessment sub-results for the city of Budapest based on regional climate projections from the EURO-CORDEX database:
DROUGHT
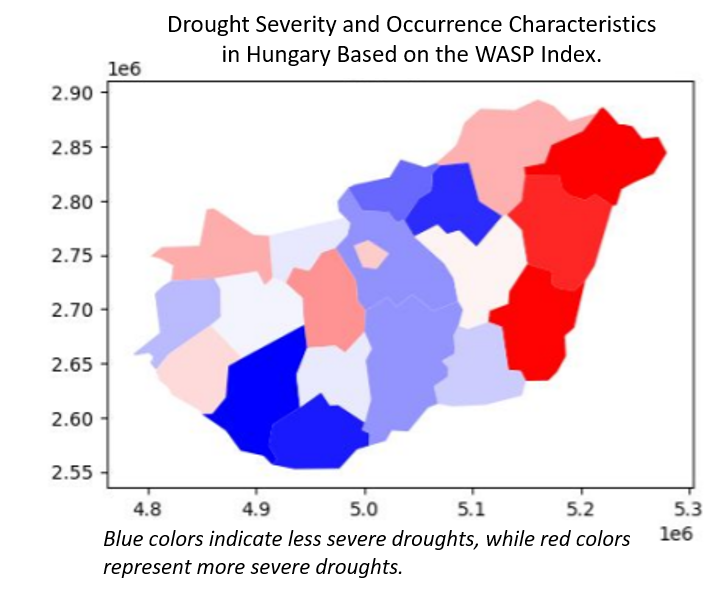
Relevant stakeholders, databases, opportunities for cooperation
|
Urban and green infrastructure planners |
Methodological support on urban green spaces, satellite data |
|
Forest managers, national parks |
Local specificities, identification of problematic places, concrete implementers, data providers |
|
Local green space managers, gardeners |
Local specificities, identification of problematic places, concrete implementers, data providers |
HEATWAVES
Relevant stakeholders, databases, opportunities for cooperation
|
Expert stakeholder group |
Determination of indicators, data providers |
|
Organisations working with vulnerable groups |
Representation of the vulnerable population, identification of soft aspects |
|
Citizens |
Sharing own experiences, mapping specific problematic locations |
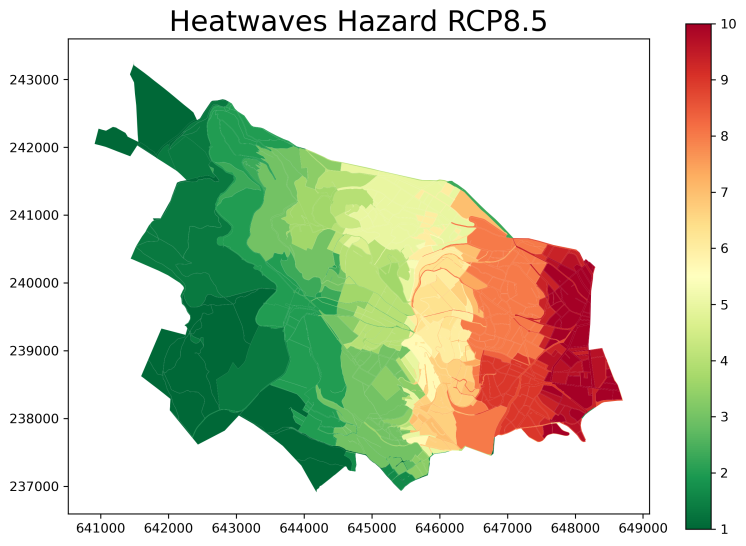
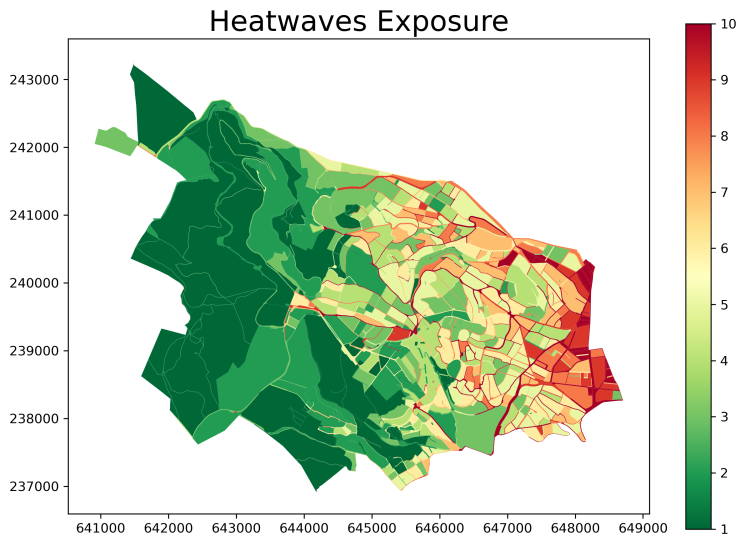
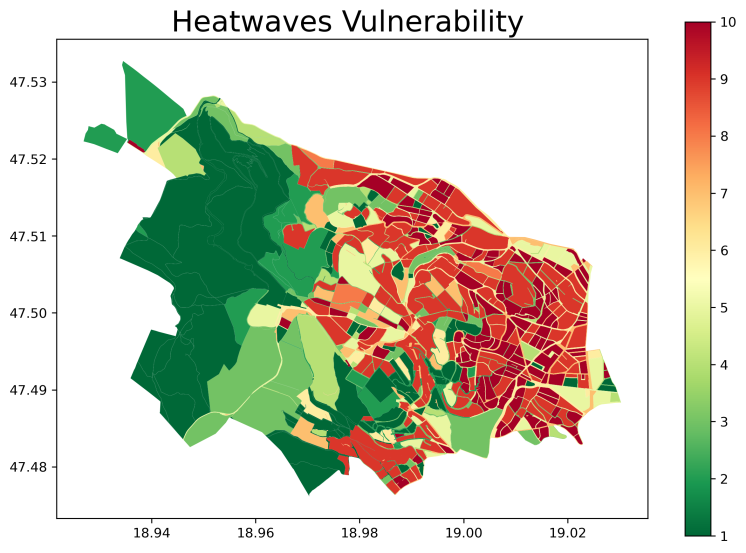
Heatwaves hazard and risk assessment sub-results on urban block level in Hegyvidék Municipality:
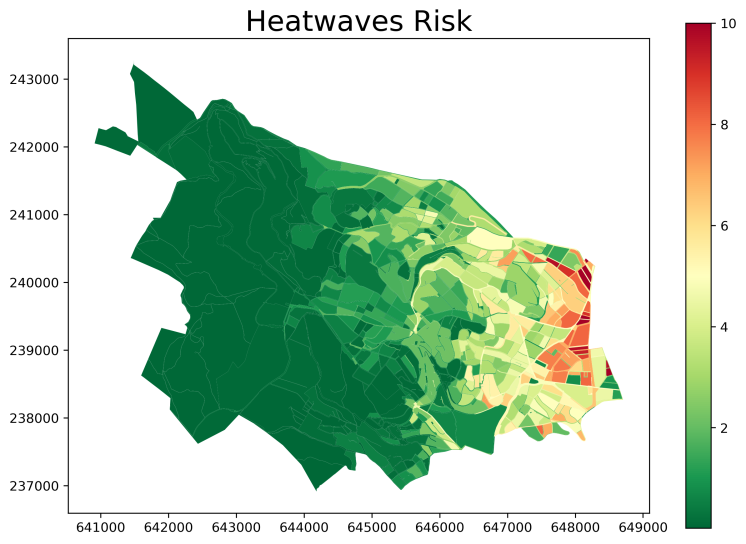
Deliverable Phase 1, 2.3.1 Workflow #1 – Heatwaves, 2.5 Preliminary Monitoring and Evaluation
DEMO AREA FOR THE IDENTIFICATION OF THE LOCAL INDICATORS
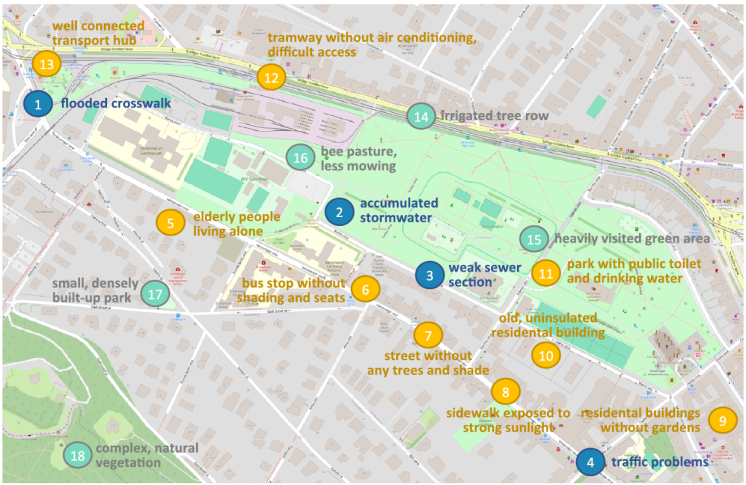
A downtown, densely built-up area with green spaces.
The figure below demonstrates some features and problematic locations suggested by the expert and the communitcy stakeholder groups related to heavy rain, heatwaves and drought. Based on the stakeholders’ inputs, we formulated the exact indicators and the data sources to be incorporated in the risk analyses.
|
HEAVY RAIN |
|||
|
Indicator |
Risk component |
Data source |
Explanation |
|
1. Rainwater runoff |
Exposure |
Runoff modelling |
A runoff modelling (SWMM) is developed for the district, allowing the identification of the flooded areas for different rain quantity. |
|
2. Low points |
Vulnerability |
Relief, slope |
Rainwater tends to accumulate in topographical low points. |
|
3. Vulnerability of the sewer system |
Vulnerability |
Vulnerability assessment of the sewer system |
The vulnerability assessment of the sewer system allows the identification of weak sections, where surchage is most probable. It is based on for example the sewer’s age and diameter. |
|
4. Traffic jams and delays during heavy rain events |
Vulnerability |
Budapest Public Transport traffic data |
In case of heavy rain traffic jams regularly occur at specific locations. |
|
HEATWAVES |
|||
|
Indicator |
Risk component |
Data source |
Explanation |
|
1. Households with only +65-year old people
|
Vulnerability |
National statistical data |
Elderly people living alone aren’t immidiately assisted when they feel ill in heatwaves. |
|
2. Bus stop equipment type
|
Exposure |
Budapest Public Transport data base |
Elderly people travel daily by public transport even in heatwaves. Shaded bus stops are crucial for safe waiting. |
|
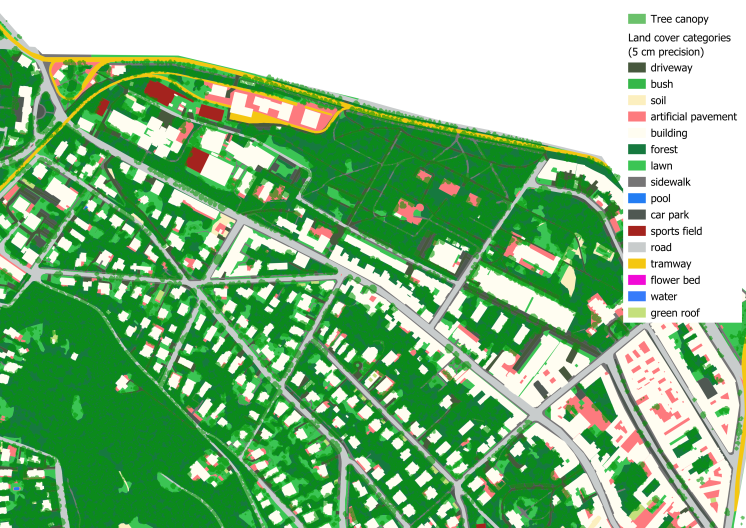
3. Shading by trees and buildings |
Exposure |
Land cover data (tree canopy size), shade mapping |
Shades and trees are able to moderate temperature in public spaces. |
|
4.Geographical orientation
|
Exposure |
South and West oriented areas are the most exposed to strong sunlight. |
|
|
5. Share of built-up area |
Exposure |
Land cover data |
Buildings and paved surfaces intensify heat island effects. |
|
6.Building age and masonry
|
Vulnerability |
National statistical data |
Old buildings are rarely insulated, while different building materials are less resistant to heatwaves, causing high tempreatures in the flats. |
|
7.Location of public toilets and drinking water fountains
|
Exposure |
Municipal data base |
Visits to green spaces are essential during heatwaves, however only the availability of public toilets and drinking water allows longer stays. |
|
8.Suitability of public transport vehicles to disabled people, air conditioned vehicles.
|
Vulnerability |
Budapest Public Transport data base |
Elderly people travel daily by public transport even in heatwaves. The easy access and the air conditioning of the vehicles are essential for safe travels. |
|
9. Walking distance to the closest public transport stop
|
Vulnerability |
Own walkability calculation |
Elderly people travel daily by public transport even in heatwaves. The walking distance tot he closest and well connected stop is essential for safe access. |
|
DROUGHT |
|||
|
Indicator |
Risk component |
Data source |
Explanation |
|
1. Irrigation system |
Vulnerability |
Municipal green space maintenance data base |
Irrigated green areas are more resistant to drought. |
|
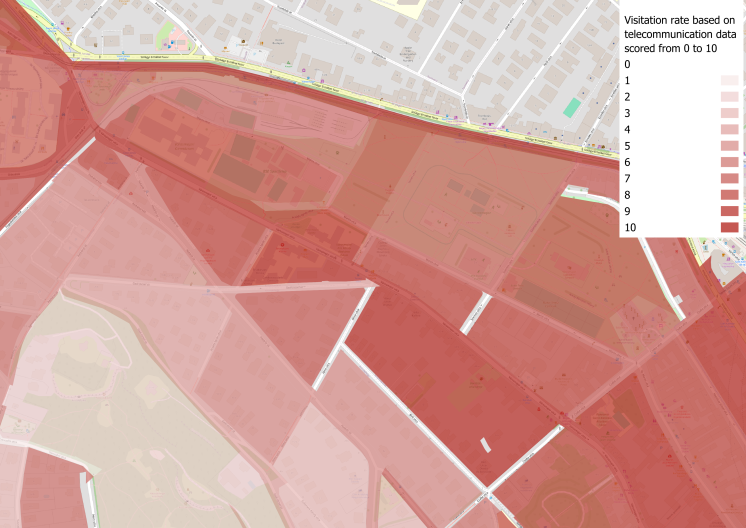
2. Pedestrian visitation rate
|
Vulnerability |
Telecommunication data |
Green areas crowded on a daily basis deteriorate fast and become les resilient. |
|
3. Mowing order |
Vulnerability |
Municipal green space maintenance data base |
Green areas mowed less frequently are more resilient to heatwaves than regularly mowed lawns. |
|
4. Size and built-up rate of green spaces |
Exposure |
Land cover data |
Small and tightly enclosed green spaces by dense urban tissue are less resistant to drought. |
|
5. Vertical layers of the vegetation |
Vulnerability |
Land cover data, Municipal green space maintenance data base |
Complex, multi-layered and diverse vegetation are the strongest and most resilient to drought. |
PROGRESS
- Learning the Climaax methodology
- Test of workflows on regional level
- Collection of regional data, mapping local data collection options
- Development of local stakeholder analysis
- Development of community involvement methodology
- 1 expert stakeholder meeting focused on heatwaves and heavy rain
- Starting the local adaptation of the heatwaves workflow
- Collection of relevant local data
- 1 expert stakeholder meeting focused on drought
- 1 community stakeholder meeting focused on vulnerable groups
- Climaax Workshop in Barcelona
- Local adaptation of the 3 workflows
- Bilateral meetings with stakeholders
- Risk analysis
- Validation of results with stakeholders
- Publications and dissemination actions
- Community involvement activities
CONTACT US
zoldpont@hegyvidek.hu
More about the CLIMAAX project: https://www.climaax.eu/